1. Download Human Genome Reference from NCBI using NC_0000* at the Search functionality of CLC; download the top 24 sequences to a new folder under CLC_data folder; change the name of each file to chr1, chr2 et al. -- they are all .clc files in CLC now.
2. Annotate_with_GTF: download the GTF file of human genome from the UCSC genome browser (follow the manual and choose ALL_SNP_132); save it under the folder of "humansnps(ALL_SNP_132)_1010" (unzip it and give a file extension gtf to it). Then this gtf file will match 24 chromosomes above as annotating.
Simply follow the manual; the annotation will be added to the original 24 chromosomes' clc files -- they are ready for mapping reads to reference.
3. Map reads to reference: follow the manual "Genomics_Gateway_User_Manual"; select "Homo sapiens tracks"; uncheck "Add tracks to existing track set".
It takes 24 hours.
4. A new track "Homo sapiens reads track" will be saved under the same folder.
5. SNP detection: follow the default setting except min coverage set to be 100.
Monday, October 17, 2011
CLC_Genomics_WB: Human Genome from Ensembl
CLC was updated to 4.8 and three plugins were upgraded as well by Bob today.
1. Download human genome FASTA files from Ensembl ftp site: chromosome 1-22 plus X and Y; save them at a local drive (file extension is gz); unzip them (file extension is fa); keep all names as they are.
ftp://ftp.ensembl.org/pub/release-64/fasta/homo_sapiens/dna/
2. Upload all fa files to CLC server (a folder other than CLC_data): "Human Genome Ensembl (Sept 2011)".
This step takes a while; better to do it one file by one file.
3. IMPORT these fa files to a new folder "Human Genome Ensembl (Sept 2011) Imported" under the CLC_data folder: then these files will be converted to .clc files and names were changed to simple numbers.
This step is fast.
4. Define reference genome: simply follow the manual. Notes: at Figure 2.1, "Annotation tracks" is not available because Ensembl FASTA files don't have annotation, so this functionality is irrelevant.
Click "Create sequence track" and "Copy data to new tracks".
Save results to a new folder "Human Genome Ensembl (Sept 2011) Imported Track".
5. Download annotations from Ensembl: simply follow the manual.
Unchecked COSMIC;
Checked dbSNP: 1000genomes, HapMap; Clinical/LSDB.
Save results to the same folder "Human Genome Ensembl (Sept 2011) Imported Track".
This step took about 90 minutes.
Wednesday, May 4, 2011
NGS: understanding cancer genomes
http://www.nature.com/nrg/journal/v11/n10/pdf/nrg2841.pdf
impressive review... read many times please!
impressive review... read many times please!
Monday, May 2, 2011
Combining homozygosity mapping with exome capture: SDCCAG8 and retinal-renal ciliopathy
http://www.nature.com/ng/journal/v42/n10/full/ng.662.html
Combining homozygosity mapping with exome capture
The finding that most known NPHP-RC genes caused the disorder only in a small number of cases (<1%)9necessitated the ability to map and identify disease genes in single families. We therefore developed a strategy that combines homozygosity mapping in single families13 with exon capture and consecutive massively parallel sequencing14. Using the NimbleGen 385K platform, we designed a ciliopathy candidate exon capture array, which contains oligonucleotides that interrogate ~13,000 exons from the 'UCSC Gene' annotation (see URLs) of 828 NPHP-RC candidate genes. Candidate genes were derived from ciliopathy animal models, from the photoreceptor sensory cilia proteome15 and from other candidate sources16(Supplementary Tables 1–3).
Because exon capture with subsequent massively parallel sequencing yields too many variants from normal reference sequence (VRSs) to make a safe call regarding the disease-causing mutation14, we devised a strategy of a priori reduction of VRSs (Supplementary Table 1). These a priori restriction criteria consisted of: (i) capturing only ~13,000 ciliopathy candidate exons instead of all ~180,000 exons from the collaborative consensus coding sequence (CCDS) project (~15-fold reduction; Supplementary Table 1); (ii) evaluating coding SNPs, splice variants and indels only (as other variants will be difficult to interpret); (iii) removing VRSs from a database of innocuous SNPs (dbSNP130; 2.3-fold reduction); (iv) evaluating only within the mapped homozygous candidate region of an individual or family (~20-fold reduction); and (v) preferentially evaluating truncating mutations (~4-fold reduction). This approach allowed us to reduce the number of VRSs by an average of ~2,760-fold and led to the identification of the disease-causing gene in 3 out of 5 attempts (Supplementary Table 1). We discovered homozygous mutations in the known NPHP-RC genes AHI1 (family A2045) and INVS (family A128; Supplementary Table 1). More importantly, we discovered a homozygous mutation in SDCCAG8 as a new cause of NPHP-RC (Supplementary Table 1).
NGS Statistics: GRIN2A and melanoma by Yardena Samuels
http://www.nature.com/ng/journal/v43/n5/pdf/ng.810.pdf
We conducted an exome resequencing of 14 matched normal and metastatic tumor DNAs from untreated individuals with melanoma. We enriched exonic sequences using Agilent's SureSelect technology for targeted exon capture6, targeting 37 Mb of sequence from exons and their flanking regions in ~20,000 genes. We performed sequencing with the Illumina GAII platform and aligned the reads using ELAND (Illumina, Inc.) followed by cross_match (see URLs) to the reference human genome (build 36.1). On average, we generated 12 Gb of sequence per sample to a mean depth of 180× or greater to achieve exome builds with at least 90% of the exons covered by high quality genotype calls. To eliminate common germline mutations, we removed any potential somatic mutation that was observed in dbSNP130 or in the 1000 Genomes Project data. To determine which of these alterations were somatic (that is, tumor-specific), we compared these data to the matched normal tissue. From these putative alterations, we identified 5,161 potential somatic mutations in 3,568 different genes in the 14 samples sequenced.
Tuesday, April 26, 2011
enrich templates - capture method - hybrid selection method
http://www.ncbi.nlm.nih.gov/pubmed/19182786

Targeting genomic loci by massively parallel sequencing requires new methods to enrich templates to be sequenced. We developed a capture method that uses biotinylated RNA 'baits' to fish targets out of a 'pond' of DNA fragments. The RNA is transcribed from PCR-amplified oligodeoxynucleotides originally synthesized on a microarray, generating sufficient bait for multiple captures at concentrations high enough to drive the hybridization. We tested this method with 170-mer baits that target >15,000 coding exons (2.5 Mb) and four regions (1.7 Mb total) using Illumina sequencing as read-out. About 90% of uniquely aligning bases fell on or near bait sequence; up to 50% lay on exons proper. The uniformity was such that approximately 60% of target bases in the exonic 'catch', and approximately 80% in the regional catch, had at least half the mean coverage. One lane of Illumina sequence was sufficient to call high-confidence genotypes for 89% of the targeted exon space.

Figure 1. Overview of hybrid selection method. Illustrated are steps involved in the preparation of a complex pool of biotinylated RNA capture probes (“bait”; top left), whole-genome fragment input library (“pond”; top right) and hybrid-selected enriched output library (“catch”; bottom). Two sequencing targets and their respective baits are shown in red and blue. Thin and thick lines represent single and double strands, respectively. Universal adapter sequences are grey. The excess of single-stranded non-self-complementary RNA (wavy lines) drives the hybridization. See main text and Methods for details.
genome sequencing using reversible terminator chemistry (Illumina)
http://www.nature.com/nature/journal/v456/n7218/full/nature07517.html

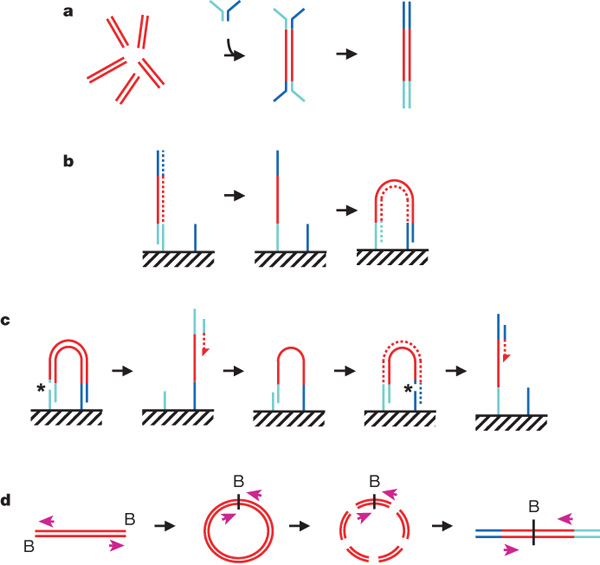
a, DNA fragments are generated, for example, by random shearing and joined to a pair of oligonucleotides in a forked adaptor configuration. The ligated products are amplified using two oligonucleotide primers, resulting in double-stranded blunt-ended material with a different adaptor sequence on either end. b, Formation of clonal single-molecule array. DNA fragments prepared as in a are denatured and single strands are annealed to complementary oligonucleotides on the flow-cell surface (hatched). A new strand (dotted) is copied from the original strand in an extension reaction that is primed from the 3' end of the surface-bound oligonucleotide; the original strand is then removed by denaturation. The adaptor sequence at the 3' end of each copied strand is annealed to a new surface-bound complementary oligonucleotide, forming a bridge and generating a new site for synthesis of a second strand (dotted). Multiple cycles of annealing, extension and denaturation in isothermal conditions result in growth of clusters, each ~1um in physical diameter. This follows the basic method outlined in ref. 33. c, The DNA in each cluster is linearized by cleavage within one adaptor sequence (gap marked by an asterisk) and denatured, generating single-stranded template for sequencing by synthesis to obtain a sequence read (read 1; the sequencing product is dotted). To perform paired-read sequencing, the products of read 1 are removed by denaturation, the template is used to generate a bridge, the second strand is re-synthesized (shown dotted), and the opposite strand is then cleaved (gap marked by an asterisk) to provide the template for the second read (read 2). d, Long-range paired-end sample preparation. To sequence the ends of a long (for example, >1 kb) DNA fragment, the ends of each fragment are tagged by incorporation of biotinylated (B) nucleotide and then circularized, forming a junction between the two ends. Circularized DNA is randomly fragmented and the biotinylated junction fragments are recovered and used as starting material in the standard sample preparation procedure illustrated in a. The orientation of the sequence reads relative to the DNA fragment is shown (magenta arrows). When aligned to the reference sequence, these reads are oriented with their 5' ends towards each other (in contrast to the short insert paired reads produced as shown in a–c). See Supplementary Fig. 17a for examples of both. Turquoise and blue lines represent oligonucleotides and red lines represent genomic DNA. All surface-bound oligonucleotides are attached to the flow cell by their 5' ends. Dotted lines indicate newly synthesized strands during cluster formation or sequencing. (See Supplementary Methods for details.)
Subscribe to:
Comments (Atom)